

The transition toward renewable energy in the Gulf is accelerating at a staggering pace. Driven by monumental initiatives like Shams Dubai, the futuristic mega-city of NEOM, and vast utility-scale solar parks across Abu Dhabi and Riyadh, Middle East solar PV projects are reshaping the global energy landscape. However, the success of these multi-million-dollar investments hinges on a single, highly volatile variable: the sun. As a premier net zero electrical engineering consultancy in Dubai, we understand that the entire financial viability of a solar plant relies absolutely on securing accurate, localized GCC solar irradiance data.
Unlike a gas turbine where fuel input can be precisely measured and controlled, a solar PV plant is entirely at the mercy of meteorological phenomena. If the baseline solar data used during the initial design phase is overly optimistic or fundamentally flawed, the plant will underperform for its entire 25-year lifecycle, destroying the project’s Return on Investment (ROI). Selecting the correct datasets, and understanding the statistical probabilities that govern them, is the critical first step in transforming a theoretical solar design into a bankable, profitable reality.
Understanding GHI, DNI, and DHI
Before analyzing probability metrics, engineers and developers must speak the correct meteorological language. Solar irradiance is not a single number; it is broken down into three core solar radiation metrics. Having GHI DNI DHI explained is foundational for accurate yield modeling.
- DNI (Direct Normal Irradiance): This is the solar radiation that comes in a straight, direct line from the sun, perpendicular to the surface it hits. DNI casts strong shadows. It is the most critical metric for Concentrated Solar Power (CSP) plants (which use mirrors to focus the sun) and solar tracking systems.
- DHI (Diffuse Horizontal Irradiance): This is the sunlight that has been scattered by molecules, clouds, and dust in the atmosphere. It does not cast a sharp shadow but still provides usable light energy to solar panels.
- GHI (Global Horizontal Irradiance): This is the total amount of shortwave radiation received from above by a surface horizontal to the ground. It is the sum of the direct beam (DNI adjusted for the sun’s angle) and the diffuse light (DHI). GHI is the absolute standard and most critical metric used when evaluating standard, fixed-tilt solar PV panels.
The Probability Exceedance Metrics: What are P50 and P90?
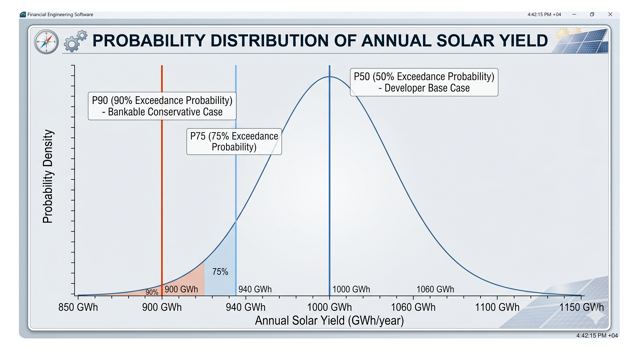
When financing a solar project, banks do not want “best guesses”; they demand statistical certainty. Because weather patterns change from year to year, engineers use Probability of Exceedance (P-values) to quantify solar probability exceedance risk.
- The P50 Value: This represents the “base case” scenario. A P50 P90 solar yield report stating a P50 of 100,000 MWh means there is a 50% probability that the actual energy yield will exceed this number in any given year, and a 50% probability it will fall short. Developers use P50 to calculate their expected equity returns.
- The P90 Value: This represents the “conservative case.” It is a much lower yield number. A P90 value means there is a 90% statistical probability that the plant will exceed this generation target. Because it represents a near-guaranteed minimum revenue stream, debt lenders and financial institutions rely almost exclusively on the P90 (and sometimes the ultra-conservative P99) value to size their loans and calculate the Debt Service Coverage Ratio (DSCR).
Satellite vs. Ground-Measured Data
The accuracy of your P90 calculation depends entirely on where your raw data comes from. There are two primary sources of solar irradiance data, and utility-scale projects require the integration of both.
- Satellite-Derived Data: This data is gathered by geostationary weather satellites. It provides broad geographic coverage and, crucially, decades of historical data necessary to calculate long-term statistical averages. However, satellites can struggle to accurately differentiate between cloud cover and the heavy dust/sand storms frequent in the GCC, leading to micro-climate inaccuracies.
- Ground-Measured Data: This data is captured by high-precision pyranometers physically installed at the project site. Ground measured irradiance is highly accurate for that specific location but is usually only collected for 12 to 24 months during the project’s development phase.
To achieve true bankability, engineers take the highly accurate, short-term ground data and use it to mathematically “calibrate” and correct the long-term satellite solar data, creating a customized, high-fidelity dataset for the specific project site.
The Albedo Effect in Desert Environments
When specifying modern solar hardware, the ground beneath the panels is almost as important as the sky above them. This brings us to the desert albedo effect.
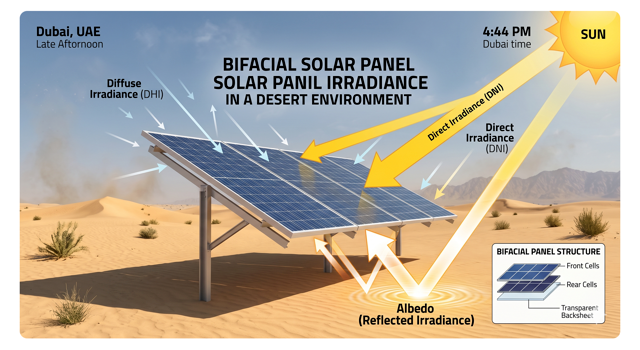
Albedo is a measure of how much sunlight is reflected off the ground. Dark asphalt has a very low albedo (approx. 0.1), meaning it absorbs light. The bright, highly reflective sand and crushed limestone of the GCC desert have a very high albedo (ranging from 0.3 to 0.45).
- The Bifacial Advantage: Modern utility-scale projects almost exclusively use bifacial solar panels, which have photovoltaic cells on both the front and the back. By accurately factoring high desert albedo into the irradiance datasets, engineers can predict the massive boost in bifacial solar yield GCC plants receive from the sunlight bouncing off the desert floor onto the rear of the panels, often increasing total plant output by 5% to 10%.
Factoring in Soiling and Dust Storms
You can have perfect irradiance data, but if the sunlight cannot physically reach the silicon cells, the plant will not perform. The ultimate enemy of solar generation in the Middle East is dust.
When modeling yields, engineers must pair raw irradiance data with highly realistic solar panel soiling loss assumptions. In the GCC, a single severe “Shamal” dust storm can deposit a layer of fine sand that drops a panel’s output by 5% to 15% in a single day.
- The Modeling Requirement: Generic assumptions (like 2% annual soiling) used in Europe will lead to catastrophic financial shortfalls. Desert dust storm PV impact must be modeled dynamically, correlating the irradiance data with local wind patterns, humidity (which turns dust to mud), and the exact frequency of the planned robotic or manual cleaning cycles.
High Ambient Temperatures and Yield Degradation
The Middle East boasts some of the highest solar irradiance levels on earth, but this intense sunlight is inextricably linked with extreme ambient heat.
- The Heat Penalty: Solar PV panels are semiconductor devices. As their temperature rises, their voltage drops, causing a significant reduction in power output. This is known as the temperature coefficient of power.
- Engineering the Solution: To accurately predict output, generic temperature assumptions are insufficient. Engineers must perform precise power load flow analysis that dynamically correlates the peak irradiance data points with the corresponding peak ambient temperature data. This mathematical modeling reveals the true PV temperature derating, proving how the solar cell heat efficiency drops exactly when the sun is at its brightest, ensuring the inverters and cables are sized accurately for the real-world power output, not a theoretical laboratory maximum.
De-Risking Mega Projects for Investors
When a developer approaches a local GCC bank or an international lender for a $200 million solar project loan, the bank will hire an Independent Engineer (IE) to audit the data.
The IE will scrutinize the source of the irradiance data, the calibration methods, and the assumed soiling and thermal losses. If the solar project finance data is deemed overly optimistic, the IE will force the developer to lower their P90 yield predictions. A lower P90 means the bank will lend less money, forcing the developer to inject more expensive equity to cover the gap, potentially killing the project’s financial viability.
- The Insurance Link: Ensuring the dataset is robust from day one ties directly into Sustainable infrastructure insurance management. When yields are backed by bankable, conservative P90 data, underwriters are far more likely to issue comprehensive operational performance policies, effectively capping the PV revenue risk management profile and securing the lender’s confidence.
Sourcing the Data: Solargis, Meteonorm, and Local Utilities
Acquiring the right data requires utilizing industry-standard meteorological platforms.
- Top Providers: In the GCC, the debate between Solargis vs Meteonorm is common. Both are highly respected commercial providers of satellite-derived solar data. Solargis, in particular, is frequently favored by independent engineers for its high-resolution modeling of the Middle Eastern atmosphere and its accuracy regarding atmospheric aerosols (dust).
- TMY Files: Regardless of the provider, the data must be downloaded as a Typical Meteorological Year (TMY) file. A TMY solar data GCC file synthesizes decades of historical weather data to create a single, representative “typical” year containing 8,760 hourly data points for GHI, DNI, DHI, temperature, and wind speed. This hourly granularity is the absolute minimum requirement for importing into advanced solar modeling software like PVSyst or SAM.
Frequently Asked Questions (FAQ)
1. What is the main difference between P50 and P90 solar data?
P50 represents the “base case” estimate, meaning there is a 50% probability the solar plant will generate that much energy in a year. P90 is a much lower, more conservative estimate, representing a 90% probability the plant will meet or exceed that generation mark. Banks rely on the P90 value because it acts as a guaranteed minimum revenue baseline to ensure debt repayment.
2. Why is GHI used for standard solar panels instead of DNI?
Direct Normal Irradiance (DNI) only measures the sunlight coming in a perfectly straight line from the sun. Standard fixed-tilt or single-axis solar panels absorb both this direct light and the scattered, ambient light (Diffuse Horizontal Irradiance – DHI) from the sky. Global Horizontal Irradiance (GHI) is the sum of both, making it the most accurate metric for standard PV panel yield calculations.
3. How does desert sand improve bifacial solar panel output?
Bifacial solar panels have active photovoltaic cells on both the front and the back. Light-colored surfaces, like GCC desert sand or crushed limestone, have a high “albedo” (reflectivity). This means a large percentage of sunlight bounces off the ground and hits the back of the solar panels, significantly increasing the total power output compared to panels installed over dark soil or asphalt.
4. Can satellite solar data be used alone for utility-scale projects?
For small commercial projects, satellite data is often sufficient. However, for massive, multi-million-dollar utility-scale solar parks, banks and independent engineers require satellite data to be “calibrated.” This means comparing decades of satellite estimates against at least 12 months of actual, localized ground data collected by physical pyranometers on the exact project site to correct any micro-climate anomalies.
5. What is a TMY file?
TMY stands for “Typical Meteorological Year.” It is not data from one specific historical year. Instead, meteorologists analyze decades of historical weather data for a specific location and stitch together the most “typical” months to create an artificial 8,760-hour year. This file provides the hourly irradiance, temperature, and wind data that engineers feed into simulation software to model annual energy yields.
Conclusion & Next Steps: Building on Solid Data
In the high-stakes realm of GCC solar development, optimism is a liability. Designing a financial model based on uncalibrated, overly aggressive P50 data is the fastest route to massive operational revenue shortfalls and loan defaults. A truly bankable project relies on a deeply conservative, highly localized understanding of the specific desert irradiance, tempered by the harsh realities of extreme heat and relentless dust.
Your solar plant will only ever be as reliable as the data used to design it.
Are you planning a commercial or utility-scale PV integration?
Do not let poor data jeopardize your project financing. Engage our expert engineering team to ensure your yield calculations are impenetrable. As a leading GCC solar consultant, Elecwatts provides the meticulous data calibration, rigorous soiling analysis, and comprehensive bankable solar yield study reports required to secure investor confidence and guarantee long-term operational success.
Contact Elecwatts today to secure the precise meteorological data and engineering analysis your renewable project demands.