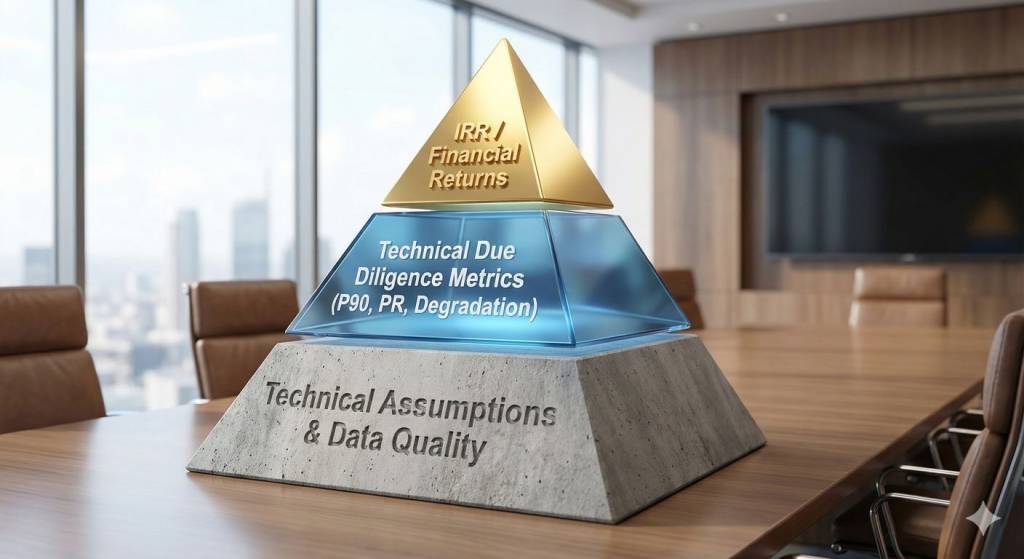
In the boardroom, the Internal Rate of Return (IRR) is king. It is the headline figure that drives investment committees to approve multi-million dollar solar projects in Saudi Arabia, the UAE, and Oman. However, seasoned investors know a dangerous truth: IRR is a derivation, not a fact. It is a house built on a foundation of technical assumptions. If those assumptions—regarding weather, equipment performance, or degradation—are even slightly off, the projected IRR is little more than a fantasy.
Sophisticated investors in 2026 do not rely on financial models alone. They dig deeper, leveraging a specific set of technical Key Performance Indicators (KPIs) to stress-test the asset’s viability. This guide explores the solar project technical due diligence metrics that uncover hidden risks and define the true quality of a GCC solar project risk profile.
Why Financial Models Need Engineering Scrutiny
A financial model is only as good as its inputs. In solar finance, the most sensitive variables are technical, not financial. For example, a mere 5% overestimate in energy yield, when compounded over a 25-year Power Purchase Agreement (PPA), can reduce the equity IRR by 20-30%.
Technical due diligence is not just about checking boxes; it is about energy yield sensitivity analysis. It is the process of stripping away optimistic marketing data to reveal the physical reality of the asset, ensuring that the financial model technical inputs are robust enough to survive the harsh reality of the GCC climate.
Protect your capital. Explore our Climate & Renewable Energy Finance and Lender’s & Owner’s Engineering services.
Metric #1: P50/P75/P90 Energy Yield – Understanding the Probability of Success
Energy yield forecasts are probabilities, not guarantees. Understanding the difference between these statistical confidence levels is critical for solar project probability analysis.
- P50 (The “Base Case”): This represents the median estimate. There is a 50% chance the actual energy yield will be higher than this figure, and a 50% chance it will be lower. Equity investors often use P50 to calculate their target upside.
- P90 (The “Bank Case”): This is the conservative estimate. There is a 90% chance the actual yield will exceed this figure. This is the P90 energy yield definition that debt providers (banks) care about. It ensures that even in bad weather years, the project generates enough cash to service its debt.
The Due Diligence Question: How was the P90 derived? Was it the result of a rigorous statistical analysis of 20+ years of satellite weather data and uncertainty modelling, or was it just an arbitrary flat discount applied to the P50?
Metric #2: Performance Ratio (PR) – The Efficiency Reality Check
The Performance Ratio (PR) is the ratio of the actual energy produced to the theoretical energy the plant could produce under ideal conditions, given the sunlight it received. It is a holistic measure of the system’s efficiency, accounting for thermal losses, conduction losses, and inverter efficiency.
The Due Diligence Question: Is the assumed first-year PR (e.g., 84%) achievable given the specific technology and the site’s climate? In the GCC, high heat and dust accumulation heavily impact PR. You must validate the solar performance ratio calculation against GCC soiling losses PR benchmarks from operational plants in the same region.
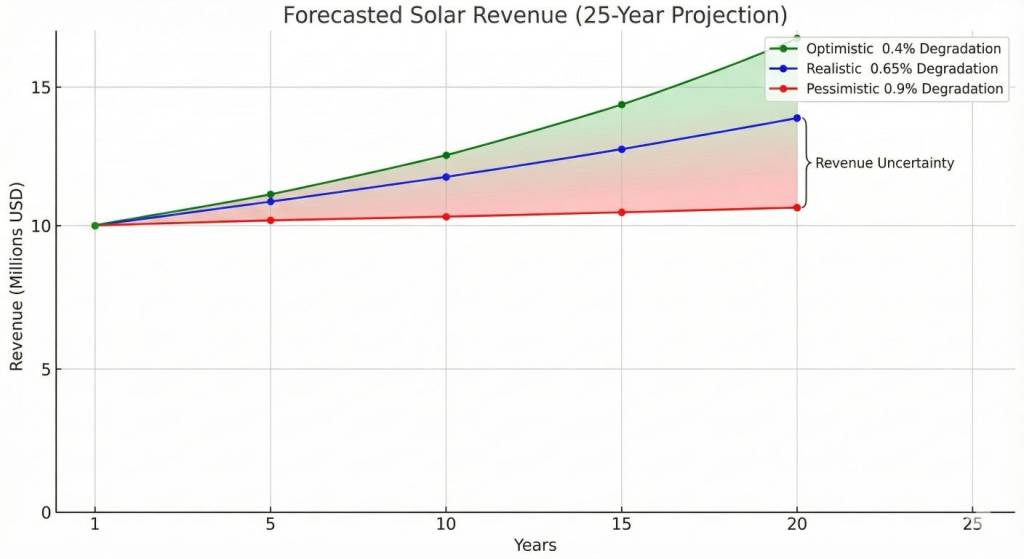
Metric #3: Degradation Rate – The Long-Term Cash Flow Erosion
Solar panels are not static; they produce slightly less energy every year. While a difference between 0.5% and 0.7% annual degradation seems minor, it creates a massive divergence in revenue over a 25-year lifecycle.
The Due Diligence Question: Does the financial model use the manufacturer’s warranted PV panel degradation rate (which is often optimistic), or a more realistic expected rate based on independent field studies? Furthermore, does the model account for Potential Induced Degradation (PID) or Light and Elevated Temperature Induced Degradation (LETID), which are risks in hot climates?
Metric #4: Capacity Factor – Contextualizing Plant Output
The Capacity Factor is the ratio of the actual energy output over a year divided by the maximum possible output if the plant ran at full nameplate capacity 24/7. It contextualizes the project’s productivity against regional norms.
The Due Diligence Question: Does the projected solar plant capacity factor GCC (e.g., 22-24% in Saudi Arabia) align with operational data from nearby plants? A figure that is significantly higher than regional averages may indicate yield over-estimation, while a lower figure may suggest poor design or excessive shading. This is essential for benchmarking solar assets.
Metric #5: Technology & O&M Due Diligence – The Quality of the Build
This metric assesses the reliability of the physical asset and the contracts governing it. It encompasses the bankability of the inverter and panel brands, the rigor of the Operations & Maintenance (O&M) contract, and the credibility of the EPC contractor.
The Due Diligence Questions:
- Inverter Availability: Is the inverter availability guarantee >99%?
- O&M Contract KPIs: Does the contract include guaranteed PR, response times for faults, and meaningful liquidated damages (LDs) for underperformance? A weak O&M contract is a major leak in future cash flows.
The Investor’s Action Plan: Validating the Metrics
To secure your investment, move from passive review to active validation:
- Commission Independent Yield Modelling: Do not rely on the developer’s numbers. Hire a third-party engineer to re-run the energy yield assessment using the same, or more conservative, inputs to verify the P50/P90 spread.
- Review the Technical Assumptions Sheet: Demand transparency. Review the loss diagram line-by-line (soiling, shading, cabling losses, unavailability) and challenge any assumption that looks too “clean.”
- Benchmark Against Operational Data: Request independent engineering review reports or production data from similar existing plants in the region to ground-truth the projections.
Frequently Asked Questions (FAQs)
Q1: Which metric is the most important for debt providers?
Lenders focus intensely on the P90 energy yield and the robustness of the O&M contract. Their primary concern is the Debt Service Coverage Ratio (DSCR) under stressed scenarios, making the conservative P90 yield the cornerstone of their credit model.
Q2: How can we trust the technical data provided by the project developer?
You generally cannot take it at face value without verification. The standard solution is to appoint an Independent Engineer (also known as a Lender’s Technical Advisor). Their sole responsibility is to verify all technical data, assumptions, and contracts on your behalf, providing a “true and fair” opinion of the project’s feasibility.
Q3: Are these metrics different for GCC projects compared to Europe or the US?
Yes, critically. The soiling loss assumption in the GCC is far higher and more variable than in Europe. Temperature-related losses are significant due to extreme ambient heat. Degradation rates may also be accelerated by high UV exposure. Due diligence must be region-specific.
Q4: Can a project with a lower IRR but stronger technical metrics be a better investment?
Often, yes. A project with a 12% IRR based on bulletproof P90 yield and strong O&M contracts is a far better investment than a project promising 15% IRR built on optimistic P50 assumptions and weak warranty terms. The former offers predictable, lower-risk returns, while the latter carries a high probability of underperformance.
Conclusion
In the competitive GCC solar market, investment success hinges on the ability to differentiate between marketing projections and engineer-validated performance. IRR tells you what you hope to earn; technical metrics tell you what you are likely to earn.
Don’t let attractive headline IRR figures obscure technical risk. Our team of owner’s and lender’s engineers provides the deep technical due diligence that investors and banks rely on to validate metrics, stress-test models, and secure financing for GCC solar projects.